Carbon Monoxide: one of the most important air pollutants
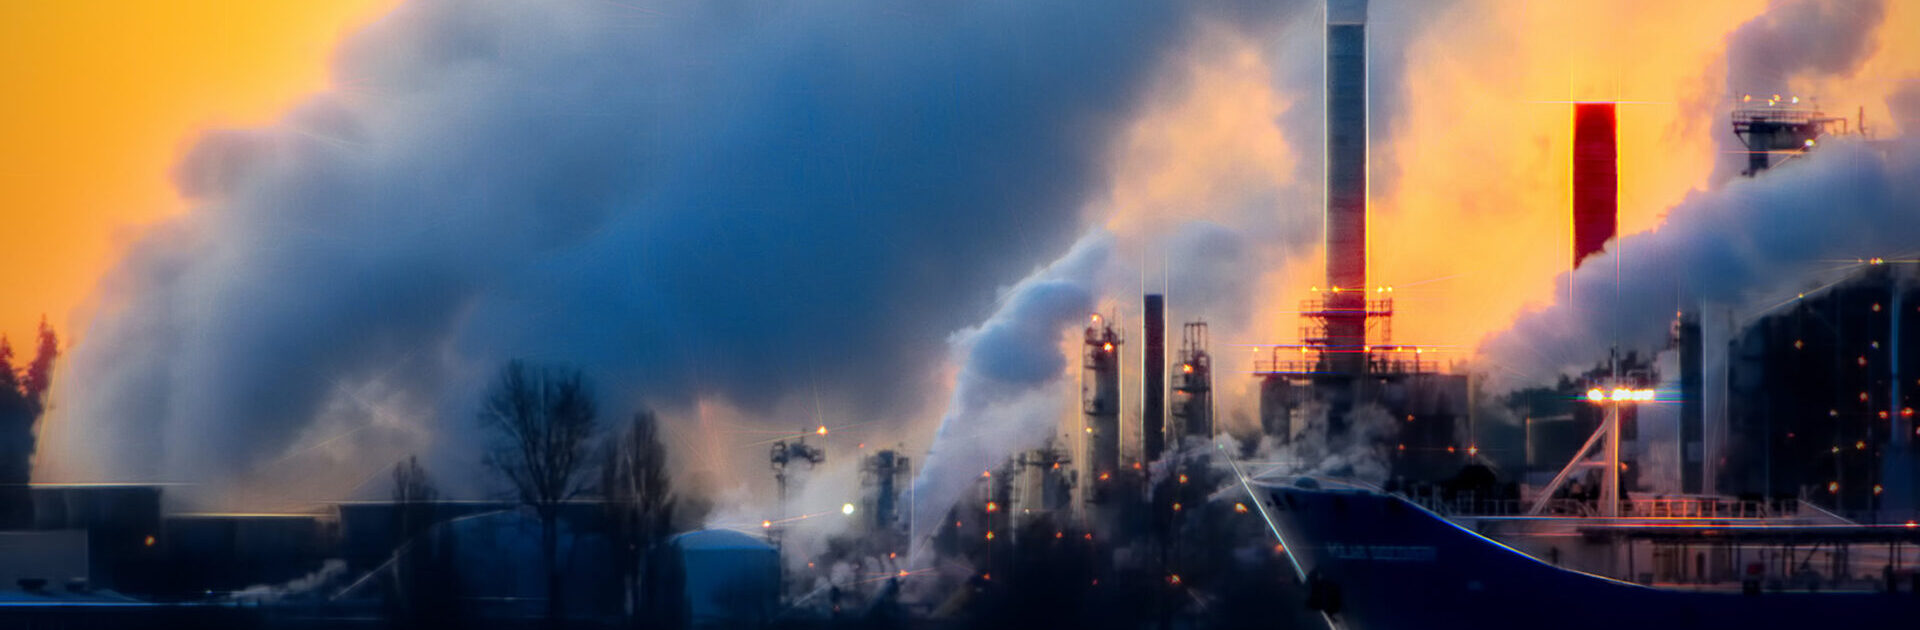
SRON’s role in carbon monoxide research
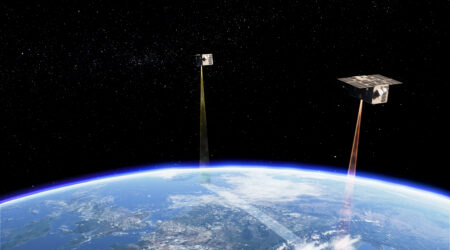
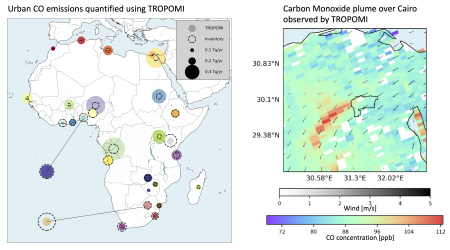
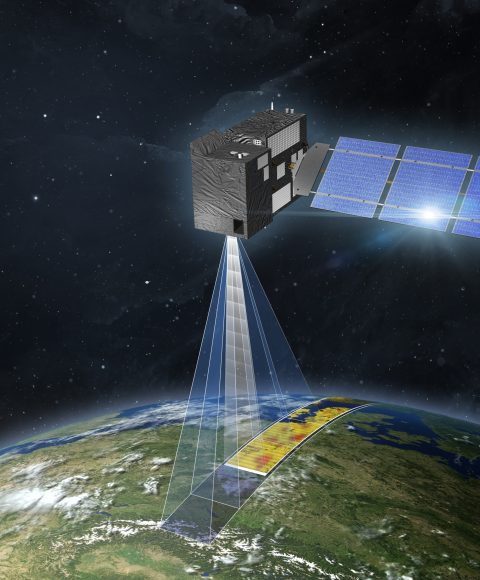
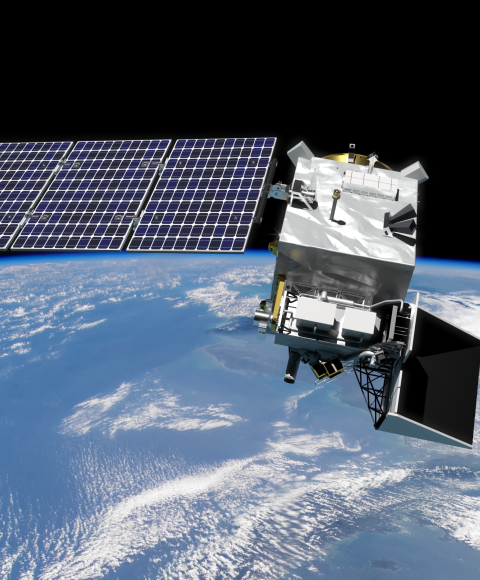
In 2017 the European Space Agency (ESA) successfully launched the Sentinel-5 Precursor satellite, carrying the instrument Tropospheric Monitoring Instrument (TROPOMI) as its only payload. TROPOMI is developed by a Dutch consortium including SRON. One of its primary products is the measurement of atmospheric carbon monoxide (CO) using SRON’s operational software. It offers daily global coverage with a spatial resolution of 7×5.5 km2. SRON will also be involved in the operational processing of CO data from the upcoming Sentinel-5 mission.
In the decade before, from 2003 to 2012, it was the SCIAMACHY instrument that first measured atmospheric CO concentrations. SCIAMACHY was developed by a German/Dutch/Belgian consortium including SRON, and was one of ten instruments onboard ESA’s Environmental Satellite (ENVISAT). With a 2.3 mu spectral range it was sensitive to CO in the atmosphere near the Earth’s surface.
-
projects
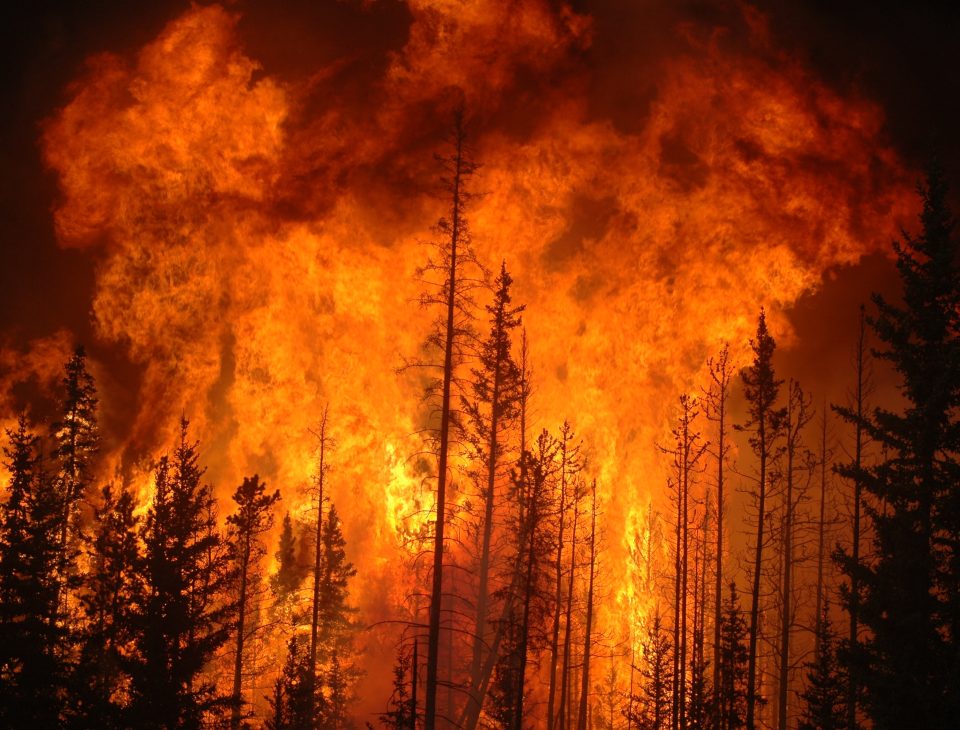
ESA Living Planet Fellowship on Fires
Landscape fires, whether natural or human-made, release pollutants, greenhouse gases and aerosols, affecting not only climate but also human health.


Recent CO Pollution news
News
21 januari 2025
News
Annual carbon monoxide emissions measured from Europe’s 21 largest steel plants
2 december 2024
News
White paper: NL-US collaboration in climate research from space
17 augustus 2023
Satellite observations African cities: carbon monoxide emissions deviate from inventories
Interactive Fire Data Map
Fire DataCarbon Monoxide Publications
1 januari 2025
Aerosols and Clouds
Comparing Space-Based To Reported Carbon Monoxide Emission Estimates For Europe’S Iron And Steel Plants
We use satellite observations of carbon monoxide (CO) to estimate CO emissions from European integrated iron and steel plants, the continent’s highest-emitting CO point sources. We perform analytical inversions to estimate emissions from 21 individual plants using observations from the TROPOspheric Monitoring Instrument (TROPOMI) for 2019. As prior emissions, we use values reported by the facilities to the European Pollutant Release and Transfer Register (E-PRTR). These reported emissions vary in estimation methodology, including both measurements and calculations. With the Weather Research and Forecasting (WRF) model, we perform an ensemble of simulations with different transport settings to best replicate the observed emission plumes for each day and site. Comparing the inversion-based emission estimates to the E-PRTR reports, nine of the plants agree within uncertainties. For the remaining plants, we generally find lower emission rates than reported. Our posterior emission estimates are well constrained by the satellite observations (90 % of the plants have averaging kernel sensitivities above 0.7) except for a few low-emitting or coastal sites. We find agreement between our inversion results and emissions we estimate using the cross-sectional flux (CSF) method for the seven most strongly emitting plants, building further confidence in the inversion estimates. Finally, for four plants with large year-to-year variability in reported emission rates or large differences between the reported emission rate and our posterior estimate, we extend our analysis to 2020. We find no evidence in either the observed carbon monoxide concentrations or our inversion results for strong changes in emission rates. This demonstrates how satellites can be used to identify potential uncertainties in reported emissions.
1 november 2024
Aerosols and Clouds
TROPOMI unravels transboundary transport pathways of atmospheric carbon monoxide in Tibetan Plateau
Numerous studies have reported in situ monitoring and source analysis in the Tibetan Plateau (TP), a region crucial for climate systems. However, a gap remains in understanding the comprehensive distribution of atmospheric pollutants in the TP and their transboundary pollution transport. Here, we analyzed the high-resolution satellite TROPOMI observations from 2018 to 2023 in Tibet and its surrounding areas. Our result reveals that, contrary to the results from in situ surface CO monitoring, Tibet exhibits a distinct seasonality in atmospheric carbon monoxide total column average mixing ratio (XCO), with higher levels in summer and lower levels in winter. This distinctive seasonal pattern may be related to the TP’s ‘air pump’ effect and the Asia summer monsoon. Before 2022, the annual growth rate of XCO in Tibet was 1.63 %·year‑1
1 augustus 2023
Aerosols and Clouds
Plume detection and emission estimate for biomass burning plumes from TROPOMI carbon monoxide observations using APE v1.1
This paper presents the automated plume detection and emission estimation algorithm (APE), developed to detect CO plumes from isolated biomass burning events and to quantify the corresponding CO emission rate. APE uses the CO product of the Tropospheric Monitoring Instrument (TROPOMI) on board the Copernicus Sentinel-5 Precursor (S5P) satellite, launched in 2017, and collocated active fire data from the Visible Infrared Imaging Radiometer Suite (VIIRS), the latter flying 3 min ahead of S5P. After identifying appropriate fire events using VIIRS data, an automated plume detection algorithm based on traditional image processing algorithms selects plumes for further data interpretation. The approach is based on thresholds optimized for data over the United States in September 2020. Subsequently, the CO emission rate is estimated using the cross-sectional flux method, which requires horizontal wind fields at the plume height. Three different plume heights were considered, and the ECMWF Reanalysis v5 (ERA5) data were used to compute emissions. A varying plume height in the downwind direction based on three-dimensional Lagrangian simulation was considered appropriate. APE is verified for observations over Australia and Siberia. For all fire sources identified by VIIRS, only 16 % of the data corresponded to clear-sky TROPOMI CO data with plume signature. Furthermore, the quality filters of APE resulted in emission estimations for 26 % of the TROPOMI CO data with plume signatures. Visual filtering of the APE’s output showed a true-positive confidence level of 97.7 %. Finally, we provide an estimate of the emission uncertainties. The greatest contribution of error comes from the uncertainty in Global Fire Assimilation System (GFAS) injection height that leads to emission errors <100 %, followed by systematic errors in the ERA5 wind data. The assumption of constant emission during plume formation and spatial under-sampling of CO column concentration by TROPOMI yields an error of <20 %. The randomized errors from the ensemble ERA5 wind data are found to be less than 20 % for 97 % of the cases.
Meet our partners
We collaborate with climate researchers and modelers, and together contribute to the development of physical instruments and the promotion of scientific activities outside SRON.
-

ESA
-

ISISspace
-

KNMI
-

TNO
-

VU
-

WUR
Our other research themes
-
Methane
-
Responsible for ¼ of human-made greenhouse effect
-
About 30 times more powerful than CO₂ (GWP-100)
-
Large emissions from fossil fuel industry, landfills, livestock
-
-
CO₂
-
Most important human-made greenhouse gas
-
Hard to monitor emissions because of long lifetime
-
-
Aerosols and Clouds
-
Small particles in the atmosphere
-
Largest unknown factor in climate change
-
Strong impact on air quality
-