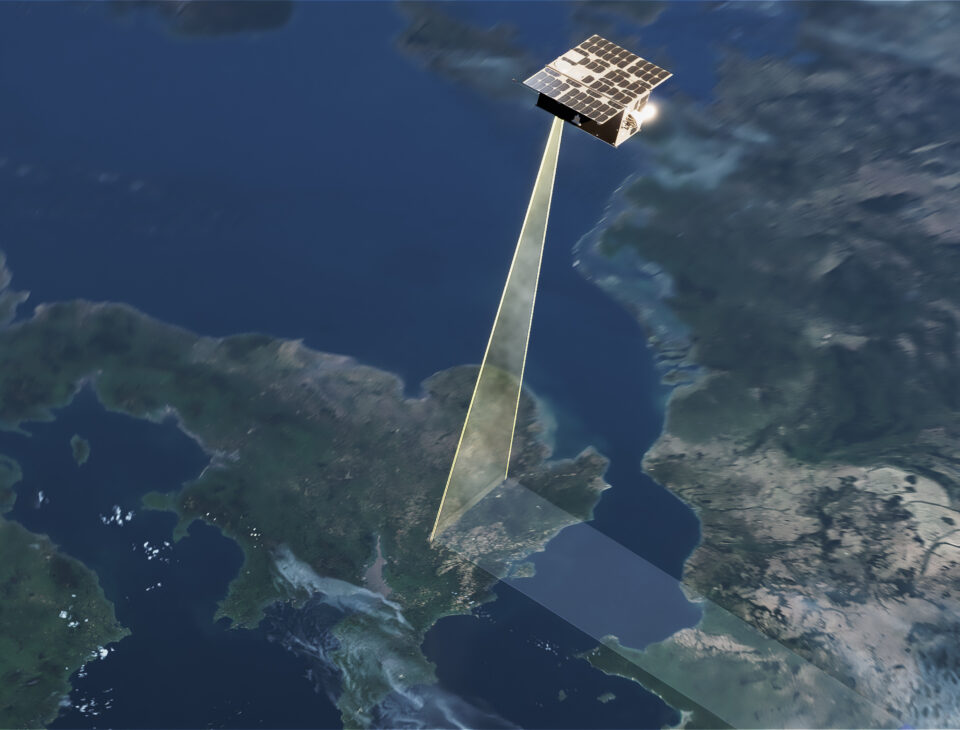
Carbon dioxide: the most important man-made greenhouse gas

SRON’s role in CO₂ research
Carbon dioxide (CO₂) is the most important man-made greenhouse gas, mostly because of the combustion of fossil fuels. Although the atmospheric concentration seems small–less than 0,05%–the rise of CO₂ has a major effect on the Earth’s climate, including global warming and the increase of extreme weather events. SRON plays a key role in the implementation and data exploitation of CO₂ monitoring missions. We support ESA and EUMETSAT with the implementation of the CO2M mission and we develop the Tango mission together with our Dutch partners ISIS Space, TNO, and KNMI.
Recent CO₂ news
News
White paper: NL-US collaboration in climate research from space
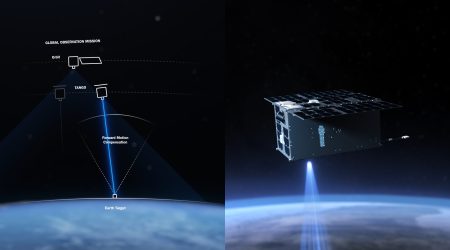
ESA selects Dutch satellite system for local emission monitoring
CO₂ Publications
Mapping The Co2 Total Column Retrieval Performance From Shortwave Infrared Measurements: Synthetic Impacts Of The Spectral Resolution, Signal-To-Noise Ratio, And Spectral Band Selection
Satellites have been providing spaceborne observations of the total column of CO2 (denoted XCO2) for over two decades now, and, with the need for independent verification of Paris Agreement objectives, many new satellite concepts are currently planned or being studied to complement or extend the instruments that already exist. Depending on whether they are targeting natural and/or anthropogenic fluxes of CO2, the designs of these future concepts vary greatly. The characteristics of their shortwave infrared (SWIR) observations notably explore several orders of magnitude in spectral resolution (from λ/Δλ ∼ 400 for Carbon Mapper to λ/Δλ ∼ 25 000 for MicroCarb) and include different selections of spectral bands (from one to four bands, among which there are the CO2-sensitive 1.6 µm and/or 2.05 µm bands). The very nature of the spaceborne measurements is also explored: for instance, the NanoCarb imaging concept proposes to measure CO2-sensitive truncated interferograms, instead of infrared spectra like other concepts, in order to significantly reduce the instrument size. This study synthetically explores the impact of three different design parameters on the XCO2 retrieval performance obtained through optimal estimation: (1) the spectral resolution, (2) the signal-to-noise ratio (SNR) and (3) the spectral band selection. Similar performance assessments are completed for the exactly defined OCO-2, MicroCarb, Copernicus CO2 Monitoring (CO2M) and NanoCarb concepts. We show that improving the SNR is more efficient than improving the spectral resolution to increase XCO2 precision when perturbing these parameters across 2 orders of magnitude, and we find that a low SNR and/or a low spectral resolution yield XCO2 with vertical sensitivities that give more weight to atmospheric layers close to the surface. The exploration of various spectral band combinations illustrates, especially for lower spectral resolutions, how including an O2-sensitive band helps to increase the optical path length information and how the 2.05 µm CO2-sensitive band contains more geophysical information than the 1.6 µm band. With very different characteristics, MicroCarb shows a CO2 information content that is only slightly higher than that of CO2M, which translates into XCO2 random errors that are lower by a factor ranging from 1.1 to 1.9, depending on the observational situation. The performance of NanoCarb for a single pixel of its imager is comparable to those of concepts that measure spectra at low SNR and low spectral resolution, but, as this novel concept would observe a given target several times during a single overpass, its performance improves when combining all the observations. Overall, the broad range of results obtained through this synthetic XCO2 performance mapping hint at the future intercomparison challenges that the wide variety of upcoming CO2-observing concepts will pose.
The impact of COVID-19 lockdowns on urban photochemistry as inferred from TROPOMI
Movement restrictions were imposed in 2020 to mitigate the spread of Covid-19. These lock-down episodes provide a unique opportunity to study the sensitivity of urban photochemistry to temporary emission reductions and test air quality models. This study uses Tropospheric Monitoring Instrument (TROPOMI) nitrogen dioxide/carbon monoxide (NO2/CO) ratios in urban plumes in combination with an exponential fitting procedure to infer changes in the NOx lifetime (τNOx) during Covid-19 lock-downs in the cities of Denver, Chicago, New York, Riyadh, Wuhan and Sao Paulo compared with the year before.
The strict lockdown policy in Wuhan led to a 65-80% reduction in NO2, compared to 30-50% in the other cities that were studied. In New York and Wuhan, CO concentration was reduced by 10-15%, whereas over Riyadh, Denver, Chicago, and Sao Paulo the CO background concentration increased by 2-5 ppb. τNOx has been derived for calm (0.0 < U (m/s) < 3.5) and windy (5.0 < U (m/s) < 8.5) days to study the influence of wind speed. We find reductions in τNOx during Covid-19 lockdowns in all six megacities during calm days. The largest change in τNOx during calm days is found for Sao-Paulo (31.8 ± 9.0%), whereas the smallest reduction is observed over Riyadh (22 ± 6.6%). During windy days, reductions in τNOx are observed during Covid-19 lockdowns in New York and Chicago. However, over Riyadh τNOx is almost similar for windy days during the Covid-19 lockdown and the year before. Ground-based measurements and the Chemistry Land-surface Atmosphere Soil Slab (CLASS) model have been used to validate the TROPOMI-derived results over Denver. CLASS simulates an enhancement of ozone (O3) by 4 ppb along with reductions in NO (38.7%), NO2 (25.7%) and CO (17.2%) during the Covid-19 lockdown in agreement with the ground-based measurements. In CLASS, decreased NOx emissions reduce the removal of OH in the NO2 + OH reaction, leading to higher OH concentrations and decreased τNOx . The reduction in τNOx inferred from TROPOMI (28 ± 9.0%) is in agreement with CLASS. These results indicate that TROPOMI derived NO2/CO ratios provide useful information about urban photochemistry and that changes in photochemical lifetimes can successfully be detected.Atmospheric CO2 inversion reveals the Amazon as a minor carbon source caused by fire emissions, with forest uptake offsetting about half of these emissions
Tropical forests such as the Amazonian rainforests play an important role for climate, are large carbon stores and are a treasure of biodiversity. Amazonian forests have been exposed to large-scale deforestation and degradation for many decades. Deforestation declined between 2005 and 2012 but more recently has again increased with similar rates as in 2007-2008. The resulting forest fragments are exposed to substantially elevated temperatures in an already warming world. These temperature and land cover changes are expected to affect the forests, and an important diagnostic of their health and sensitivity to climate variation is their carbon balance. In a recent study based on CO2 atmospheric vertical profile observations between 2010 and 2018, and an air column budgeting technique used to estimate fluxes, we reported the Amazon region as a carbon source to the atmosphere, mainly due to fire emissions. Instead of an air column budgeting technique, we use an inverse of the global atmospheric transport model, TOMCAT, to assimilate CO2 observations from Amazon vertical profiles and global flask measurements. We thus estimate inter- and intra-annual variability in the carbon fluxes, trends over time and controls for the period of 2010-2018. This is the longest period covered by a Bayesian inversion of these atmospheric CO2 profile observations to date. Our analyses indicate that the Amazon is a small net source of carbon to the atmosphere (mean 2010-2018 = 0.13 ± 0.17 Pg C yr−1, where 0.17 is the 1σ uncertainty), with the majority of the emissions coming from the eastern region (77 % of total Amazon emissions). Fire is the primary driver of the Amazonian source (0.26 ± 0.13 Pg C yr−1), while forest carbon uptake removes around half of the fire emissions to the atmosphere (−0.13 ± 0.20 Pg C yr−1). The largest net carbon sink was observed in the western-central Amazon region (72 % of the fire emissions). We find larger carbon emissions during the extreme drought years (such as 2010, 2015 and 2016), correlated with increases in temperature, cumulative water deficit and burned area. Despite the increase in total carbon emissions during drought years, we do not observe a significant trend over time in our carbon total, fire and net biome exchange estimates between 2010 and 2018. Our analysis thus cannot provide clear evidence for a weakening of the carbon uptake by Amazonian tropical forests.
Meet our partners
We collaborate with climate researchers and modelers, and together contribute to the development of physical instruments and the promotion of scientific activities outside SRON.
-

ESA
-

EUMETSAT
-

ISISspace
-

KNMI
-

TNO
-

VU
-

WUR
Our other research themes
-
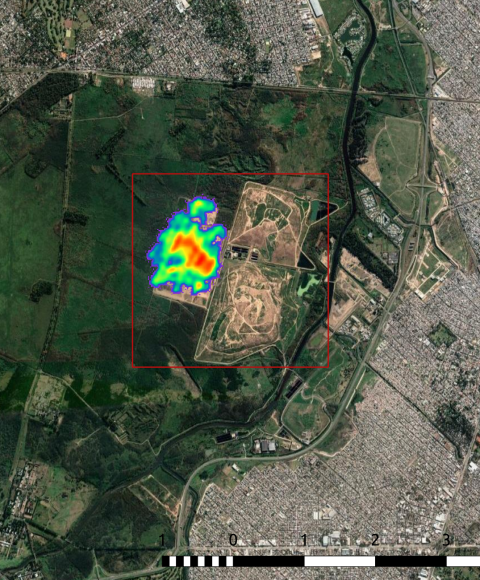
Methane
-
Responsible for ¼ of human-made greenhouse effect
-
About 30 times more powerful than CO₂ (GWP-100)
-
Large emissions from fossil fuel industry, landfills, livestock
-
-
Carbon Monoxide
-
Reactions with atmospheric gases contribute to global warming
-
Trace gas to calculate CO₂ emissions from forest fires
- One of the most important air pollutants
-
-

Aerosols and Clouds
-
Small particles in the atmosphere
-
Largest unknown factor in climate change
-
Strong impact on air quality
-
