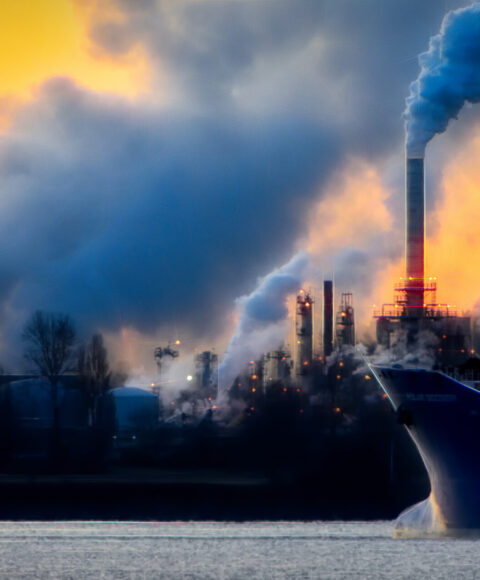
Methane: a driver of current climate change
SRON’s role in monitoring methane
Despite its seemingly low concentration in the atmosphere of less than 0.0002%, methane (CH4) is the second most important anthropogenic greenhouse gas, due to its high global warming potential. Over a period of a hundred years, methane is about thirty times more powerful than CO2. The 2021 IPCC report indicates a 0.28oC contribution to the total global warming of 1.1oC since pre-industrial times. Together with other Dutch partners, SRON has developed key technology for the TROPOMI instrument on the Copernicus Sentinel-5 Precursor mission. SRON is responsible for the CH4 data product and uses this data to estimate methane emissions worldwide. We specifically target super-emitters, for example some landfills or fossil fuel facilities. These have the potential to be the low-hanging fruit in efforts to mitigate global warming. SRON also develops the targeted TANGO mission to observe localized methane emission sources, together with our Dutch partners: ISIS Space, TNO, and KNMI.
-
projects
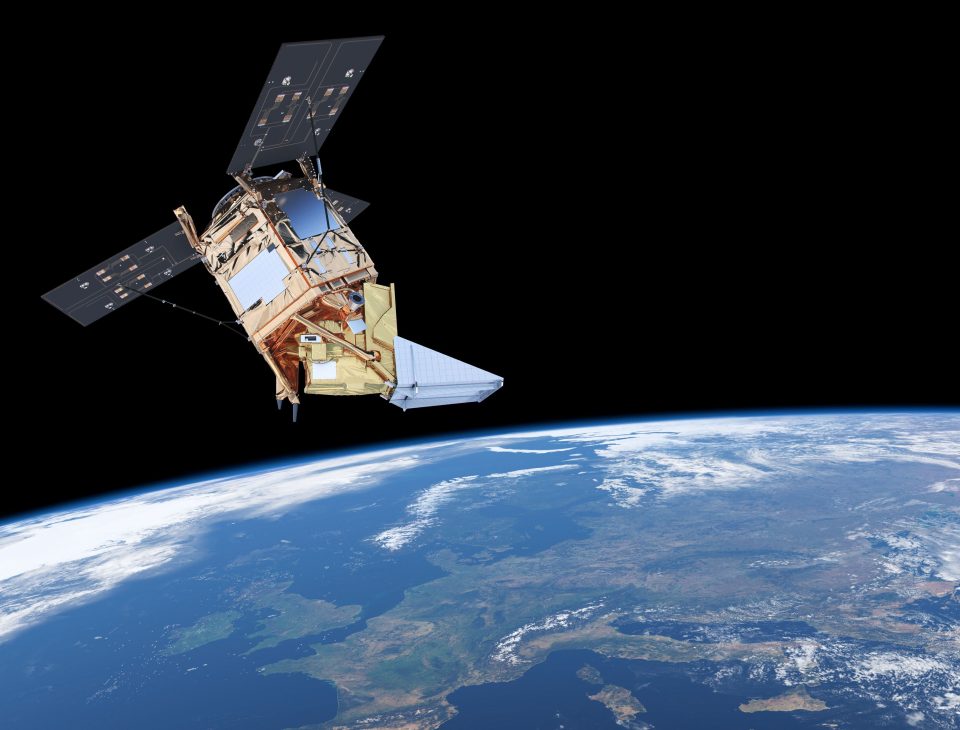
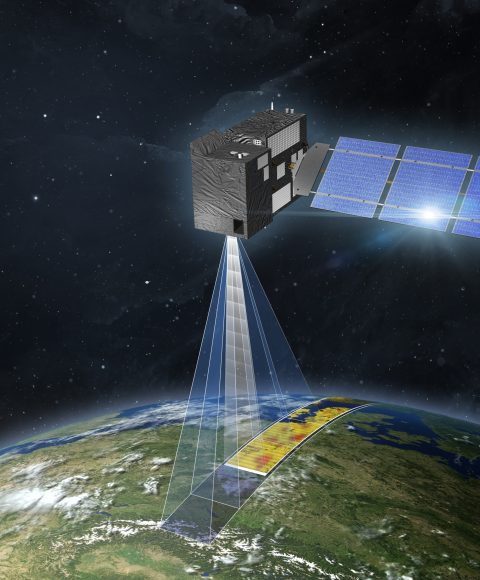
TROPOMI
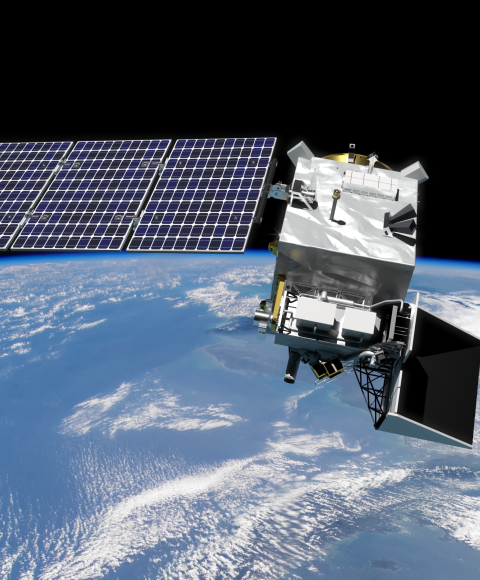
The Dutch Tropospheric Monitoring Instrument (TROPOMI) is flying onboard the Copernicus Sentinel-5p mission, launched in 2017. Every day it scans the entire globe for e.g. methane and carbon monoxide concentrations at city-scale level.
-
projects
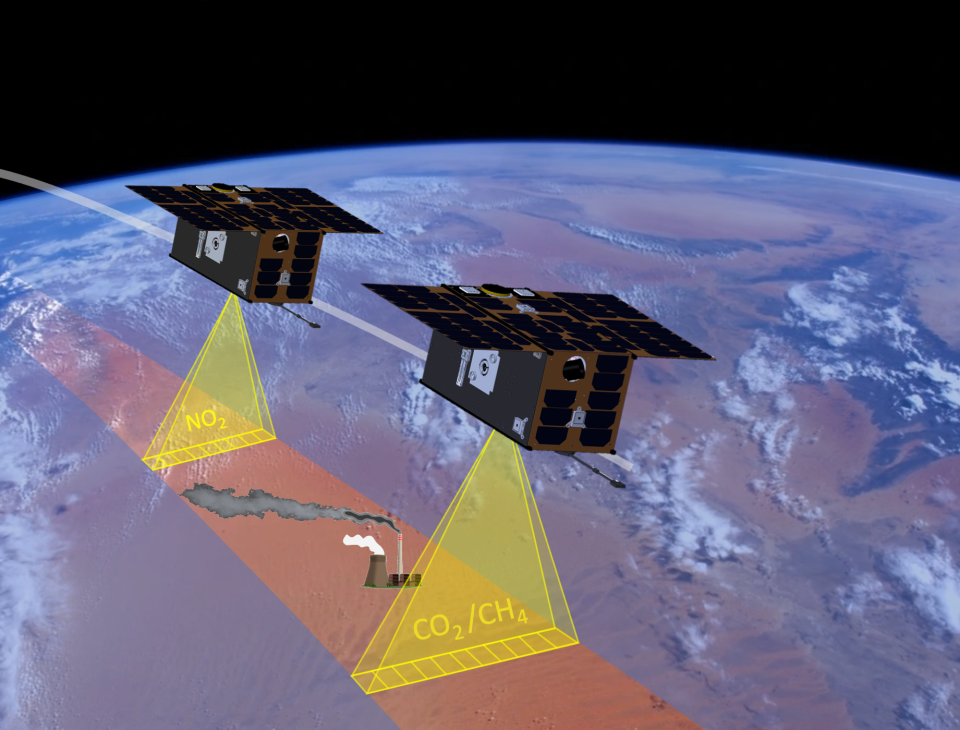
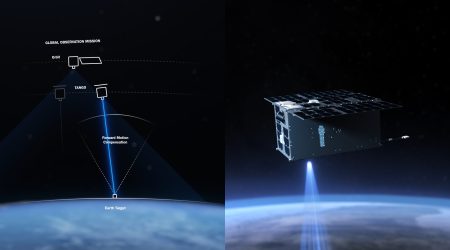
TANGO
The Twin Anthropogenic Greenhouse Gas Observers (TANGO) comprises two cubesats: TANGO-Carbon and TANGO-Nitro. It is a candidate mission of ESA’s SCOUT program to be launched in 2026.
-
projects
Impact Plan ML
We use machine learning techniques to detect methane plumes in satellite data. The first project focused on detection of methane plumes in TROPOMI data.
-
projects
IMEO MARS
The United Nations International Methane Emissions Observatory (IMEO) is setting up a Methane Alert Response System (MARS) to support governments and businesses to reduce their methane emissions as promised under the Methane Pledge.

-
projects
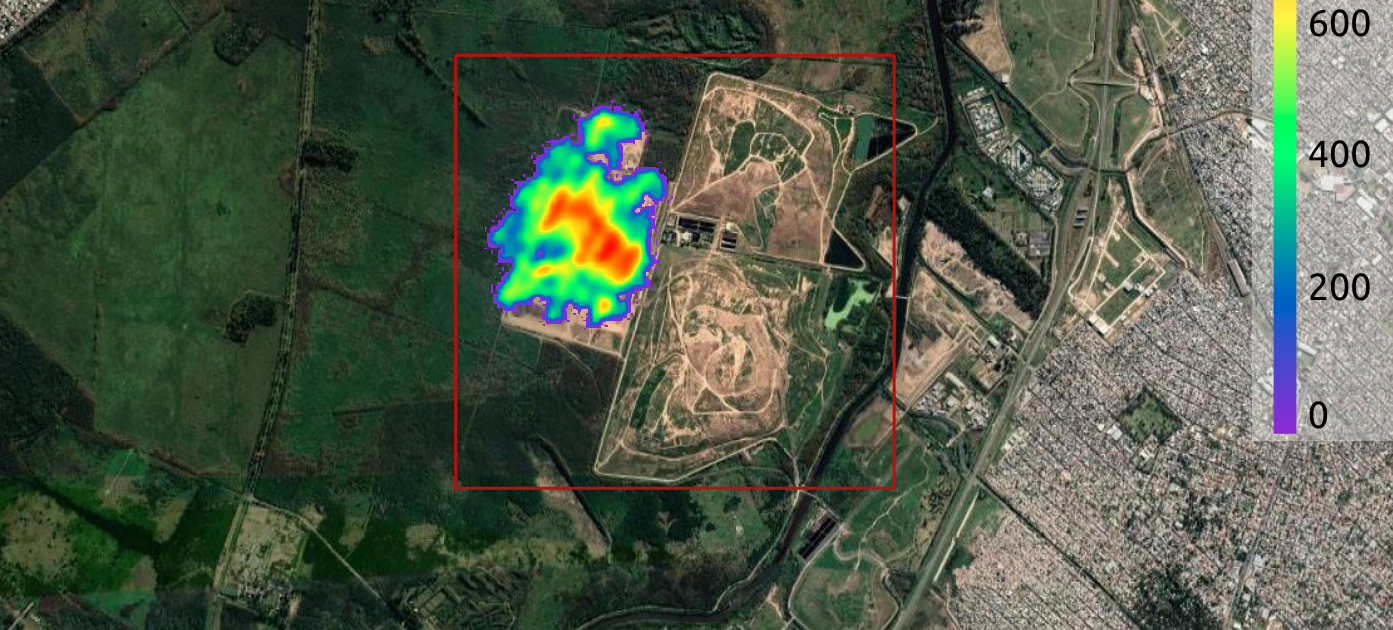
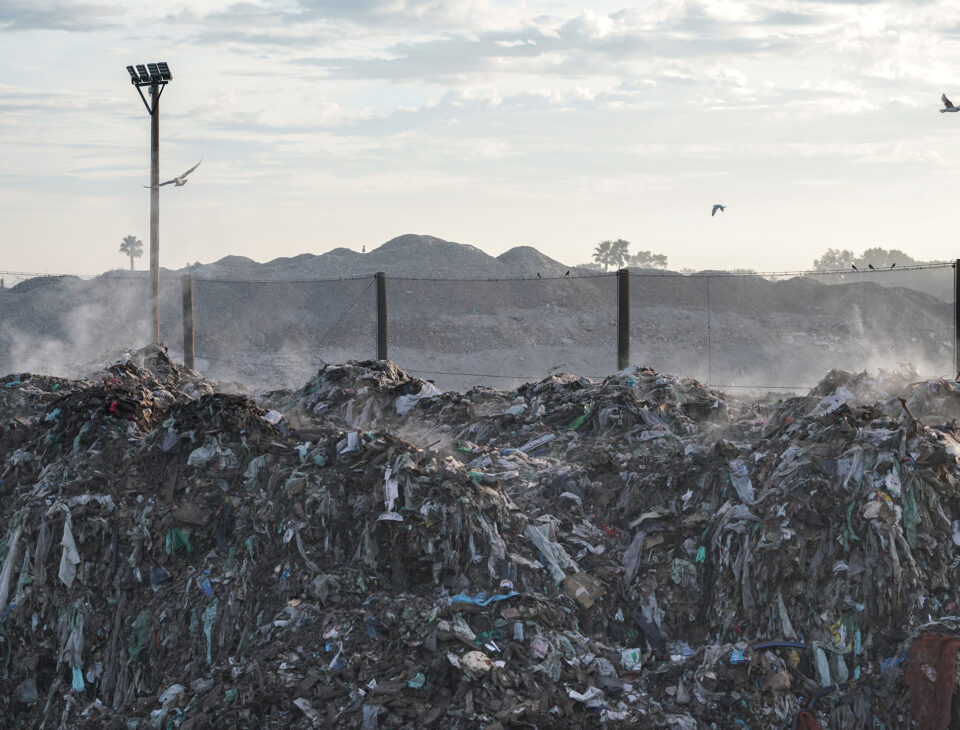
Targeting Waste Emissions Observed from Space
Emissions from landfills are responsible for about 11% of global human-made methane emissions. We have recently demonstrated we can detect and quantify large landfill methane emissions from space by using a combination of satellites.
-
projects
CCAC Methane Studies
CCAC Methane Studies is a project to estimate methane emissions from oil & gas fields using TROPOMI (and other) satellite data.


Recent methane news
News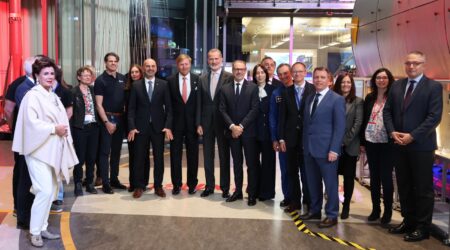
19 april 2024
News
Spanish King introduced to Dutch earth observation
21 februari 2024
News
ESA selects Dutch satellite system for local emission monitoring
2 december 2023
News
COP28: Global projects for landfill methane reduction with satellite monitoring
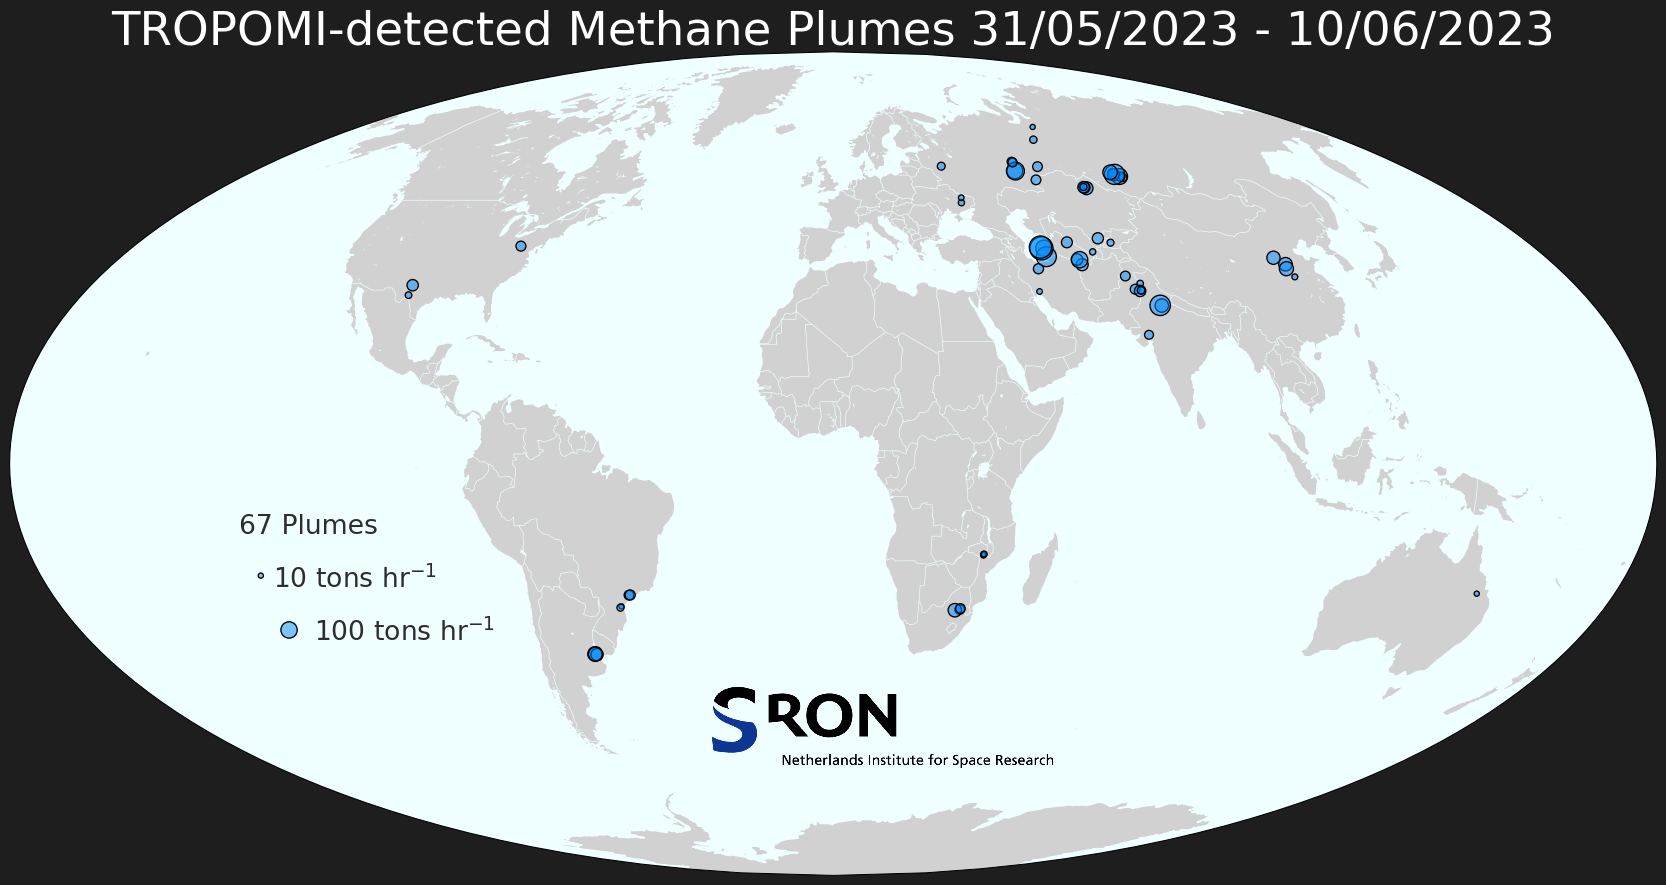
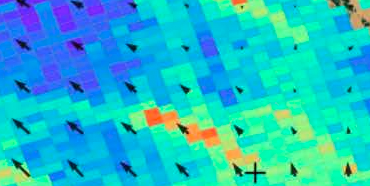
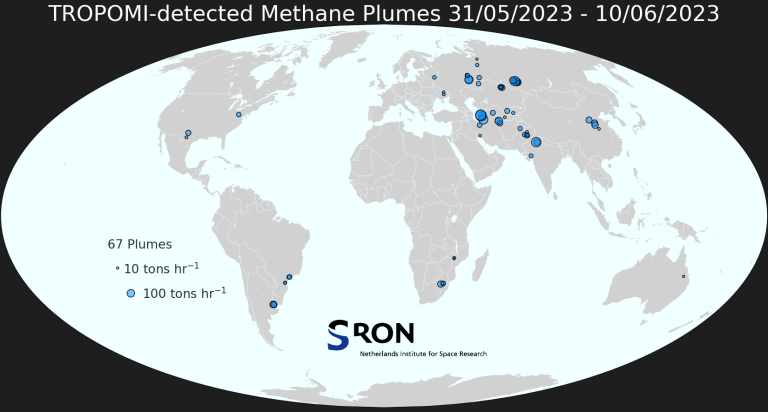
Methane Plume Map
TropomiTROPOMI aboard Sentinel-5p can be used to detect large methane emission plumes everywhere around the world. These plumes are automatically detected using the machine-learning setup described in Schuit et al. (2023). The weekly world maps show approximate source locations based on single TROPOMI plumes as well as initial source rate estimates based on an automated mass balance method.
Interactive TROPOMI carbon monoxide / methane map
Methane Publications
1 september 2023
Aerosols and Clouds
Automated detection and monitoring of methane super-emitters using satellite data
A reduction in anthropogenic methane emissions is vital to limit near-term global warming. A small number of so-called super-emitters is responsible for a disproportionally large fraction of total methane emissions. Since late 2017, the TROPOspheric Monitoring Instrument (TROPOMI) has been in orbit, providing daily global coverage of methane mixing ratios at a resolution of up to 7×5.5 km2, enabling the detection of these super-emitters. However, TROPOMI produces millions of observations each day, which together with the complexity of the methane data, makes manual inspection infeasible. We have therefore designed a two-step machine learning approach using a convolutional neural network to detect plume-like structures in the methane data and subsequently apply a support vector classifier to distinguish the emission plumes from retrieval artifacts. The models are trained on pre-2021 data and subsequently applied to all 2021 observations. We detect 2974 plumes in 2021, with a mean estimated source rate of 44 t h−1 and 5-95th percentile range of 8-122 t h−1. These emissions originate from 94 persistent emission clusters and hundreds of transient sources. Based on bottom-up emission inventories, we find that most detected plumes are related to urban areas and/or landfills (35 %), followed by plumes from gas infrastructure (24 %), oil infrastructure (21 %), and coal mines (20 %). For 12 (clusters of) TROPOMI detections, we tip and cue the targeted observations and analysis of high-resolution satellite instruments to identify the exact sources responsible for these plumes. Using high-resolution observations from GHGSat, PRISMA, and Sentinel-2, we detect and analyze both persistent and transient facility-level emissions underlying the TROPOMI detections. We find emissions from landfills and fossil fuel exploitation facilities, and for the latter, we find up to 10 facilities contributing to one TROPOMI detection. Our automated TROPOMI-based monitoring system in combination with high-resolution satellite data allows for the detection, precise identification, and monitoring of these methane super-emitters, which is essential for mitigating their emissions.
1 augustus 2023
Aerosols and Clouds
Verifying Methane Inventories and Trends With Atmospheric Methane Data
The 2015 Paris Climate Agreement and Global Methane Pledge formalized agreement for countries to report and reduce methane emissions to mitigate near-term climate change. Emission inventories generated through surface activity measurements are reported annually or bi-annually, and evaluated periodically through a “Global Stocktake.” Emissions inverted from atmospheric data support evaluation of reported inventories, but their systematic use is stifled by spatially variable biases from prior errors combined with limited sensitivity of observations to emissions (also called smoothing error), as-well-as poorly characterized information content. Here, we demonstrate a Bayesian, optimal estimation (OE) algorithm for evaluating a state-of-the-art inventory (EDGAR v6.0) using satellite-based emissions from 2009 to 2018. The OE algorithm quantifies the information content (uncertainty reduction, sectoral attribution, spatial resolution) of the satellite-based emissions and disentangles the effect of smoothing error when comparing to an inventory. We find robust differences between satellite and EDGAR for total livestock, rice, and coal emissions: 14 ± 9, 12 ± 8, -11 ± 6 Tg CH4/yr respectively. EDGAR and satellite agree that livestock emissions are increasing (0.25-1.3 Tg CH4/yr/yr), primarily in the Indo-Pakistan region, sub-tropical Africa, and the Southern Brazilian; East Asia rice emissions are also increasing, highlighting the importance of agriculture on the atmospheric methane growth rate. In contrast, low information content for the waste and fossil emission trends confounds comparison between EDGAR and satellite; increased sampling and spatial resolution of satellite observations are therefore needed to evaluate reported changes to emissions in these sectors.
1 juli 2023
Aerosols and Clouds
Continuous weekly monitoring of methane emissions from the Permian Basin by inversion of TROPOMI satellite observations
We quantify weekly methane emissions at 0.25∘ × 0.3125∘ (≈25 × 25 km2) resolution from the Permian Basin, the largest oil production basin in the US, by inverse analysis of satellite observations from the TROPOspheric Monitoring Instrument (TROPOMI) from May 2018 to October 2020. The mean oil and gas emission from the region (± standard deviation of weekly estimates) was 3.7 ± 0.9 Tg a-1, higher than previous TROPOMI inversion estimates that may have used biased prior emissions or background assumptions. We find strong week-to-week variability in emissions superimposed on longer-term trends, and these are consistent with independent inferences of temporal emission variability from tower, aircraft, and multispectral satellite data. New well development and natural gas spot price were significant drivers of variability in emissions over our study period but the concurrent 50 % increase in oil and gas production was not. The methane intensity (methane emitted per unit of methane gas produced) averaged 4.6 % ± 1.3 % and steadily decreased from 5 %-6 % in 2018 to 3 %-4 % in 2020. While the decreasing trend suggests improvement in operator practices during the study period, methane emissions from the Permian Basin remained high, with methane intensity an order of magnitude above the industry target of <0.2 %. Our success in using TROPOMI satellite observations for weekly estimates of emissions from a major oil production basin shows promise for application to near-real-time monitoring in support of climate change mitigation efforts.
Meet our partners
We collaborate with climate researchers and modelers, and together contribute to the development of physical instruments and the promotion of scientific activities outside SRON.
-

ESA
-

ISISspace
-

KNMI
-

TNO
-

VU
-

WUR
Our other research themes
-
CO₂
-
Most important human-made greenhouse gas
-
Hard to monitor emissions because of long lifetime
-
-
Carbon Monoxide
-
Reactions with atmospheric gases contribute to global warming
-
Trace gas to calculate CO₂ emissions from forest fires
- One of the most important air pollutants
-
-
Aerosols and Clouds
-
Small particles in the atmosphere
-
Largest unknown factor in climate change
-
Strong impact on air quality
-